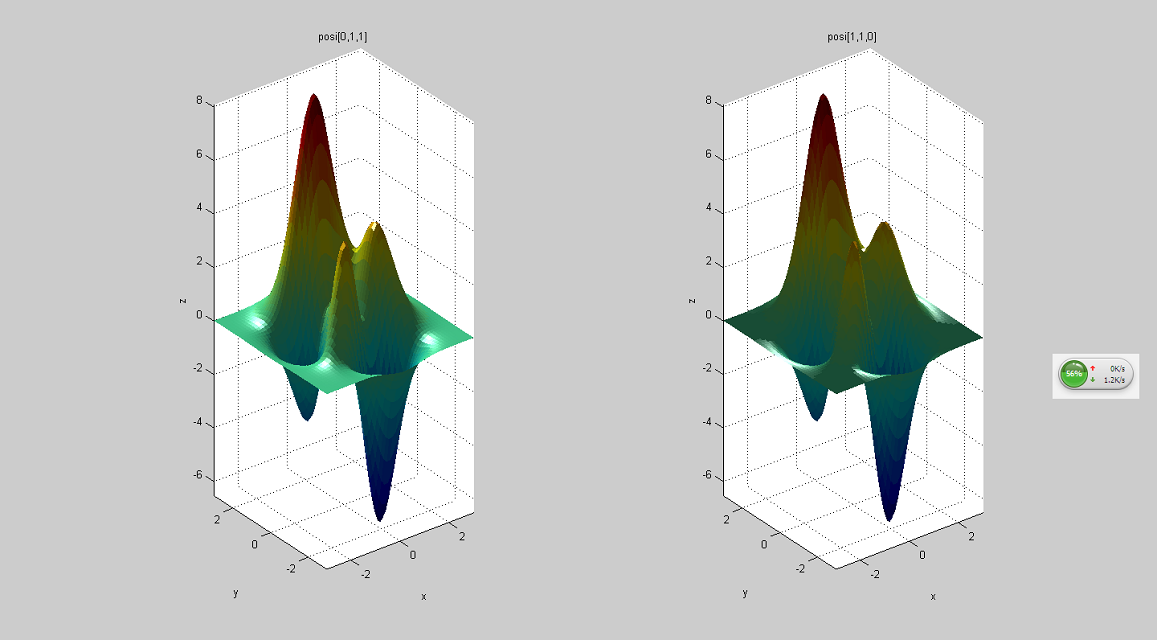
[x,y,z]=peaks;>> subplot(1,2,1);
>> surf(x,y,z);axis equal;
>> light('posi',[0,1,1]);
>> shading flat;hold on;
>> title('posi[0,1,1]');
>> xlabel('x');ylabel('y');zlabel('z');
>> subplot(1,2,2);
>> surf(x,y,z);axis equal;
>> light('posi',[1,1,0]);
>> shading flat;
>> hold on;
>> title('posi[1,1,0]');
>> xlabel('x');ylabel('y');zlabel('z');
|