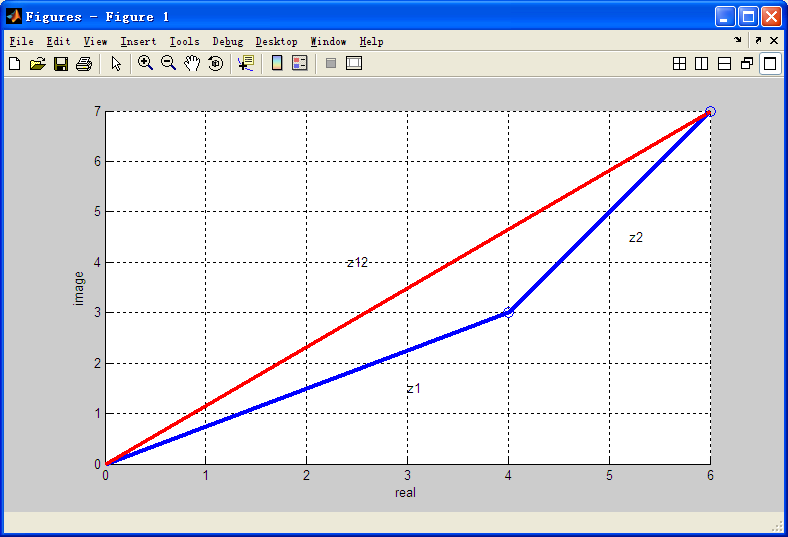
>> z1=4+3*i;z2=2+4*i;>> z12=z1+z2;
>> clf,hold on
>> plot([0,z1,z12],'-b','LineWidth',3)
>> plot([0,z12],'-r','LineWidth',3)
>> plot([z1,z12],'ob','MarkerSize',8)
>> hold off
>> grid on
>> axis([0,6,0,6])
>> axis([0,7,0,6])
>> axis([0,6,0,7])
>> text(3,1.5,'z1')
>> text(5.2,4.5,'z2')
>> text(2.4,4,'z12')
>> xlabel('real')
>> ylabel('image')
|